

Imagine you’re a surfer, standing on the shore, watching the waves crash and recede. You’re looking for the perfect moment to jump in, catch a wave, and ride it all the way to the shore. In the world of trading, the Relative Strength Index (RSI) is like your surfing guide, helping you identify those perfect moments when the market’s waves are just right for making your move.
Understanding RSI: Your Market Surfing Guide
RSI, or Relative Strength Index, is a popular tool among traders, used to measure the momentum of price changes. Think of it as a thermometer for the market's fever. It tells you that how much price is strong relative to given number of candles. This nifty indicator oscillates between 0 and 100, providing insights into whether an asset is overbought or oversold, revealing potential reversals, and identifying trends. Let’s break down its three primary uses:
- Oversold and Overbought Conditions: Picture RSI as a pendulum. When it swings too high, above 70 (or in the case of the volatile crypto market, above 80 which we recommend), it signals that the asset might be overbought. This means the price could be higher than what the market considers fair, suggesting a potential drop ahead. Conversely, when the pendulum swings too low, below 30 (or below 20 for crypto), it indicates the asset might be oversold, meaning the price could be lower than its fair value, hinting at a potential rise.
[caption id="attachment_4218" align="alignnone" width="1785"]
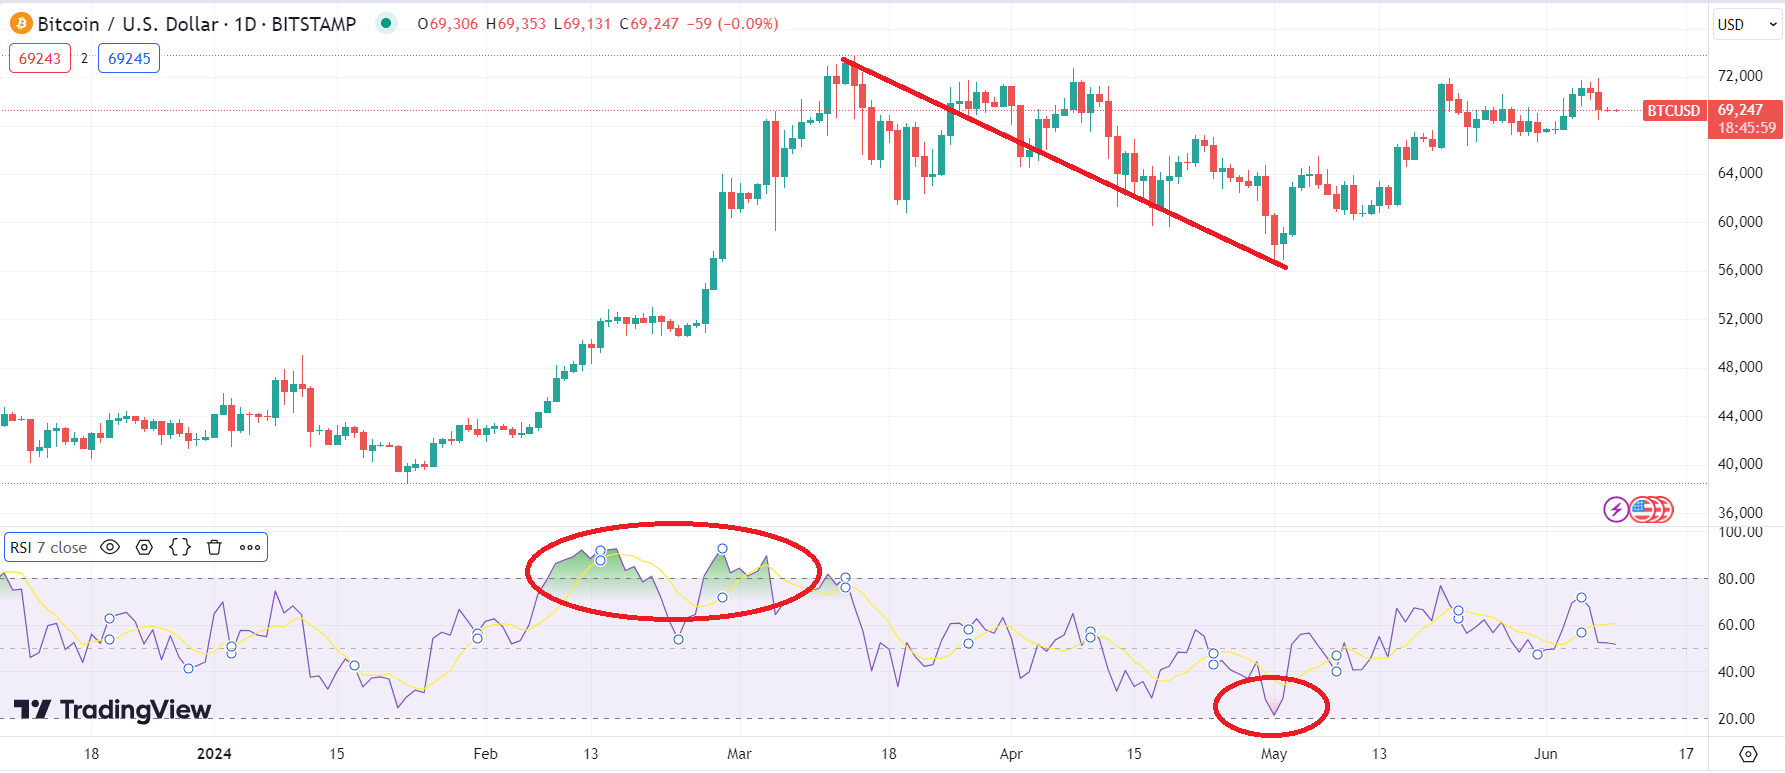 RSI on chart, going to overbought region from where price went down.[/caption]
 - Divergence: Divergence is like noticing the wind changing direction while surfing. When the price of an asset moves in one direction and the RSI moves in another, it signals a potential reversal. For example, if prices are rising but RSI is falling, it might be a clue that the upward trend is losing strength and a downward shift could be imminent.
[caption id="attachment_4219" align="alignnone" width="1795"]
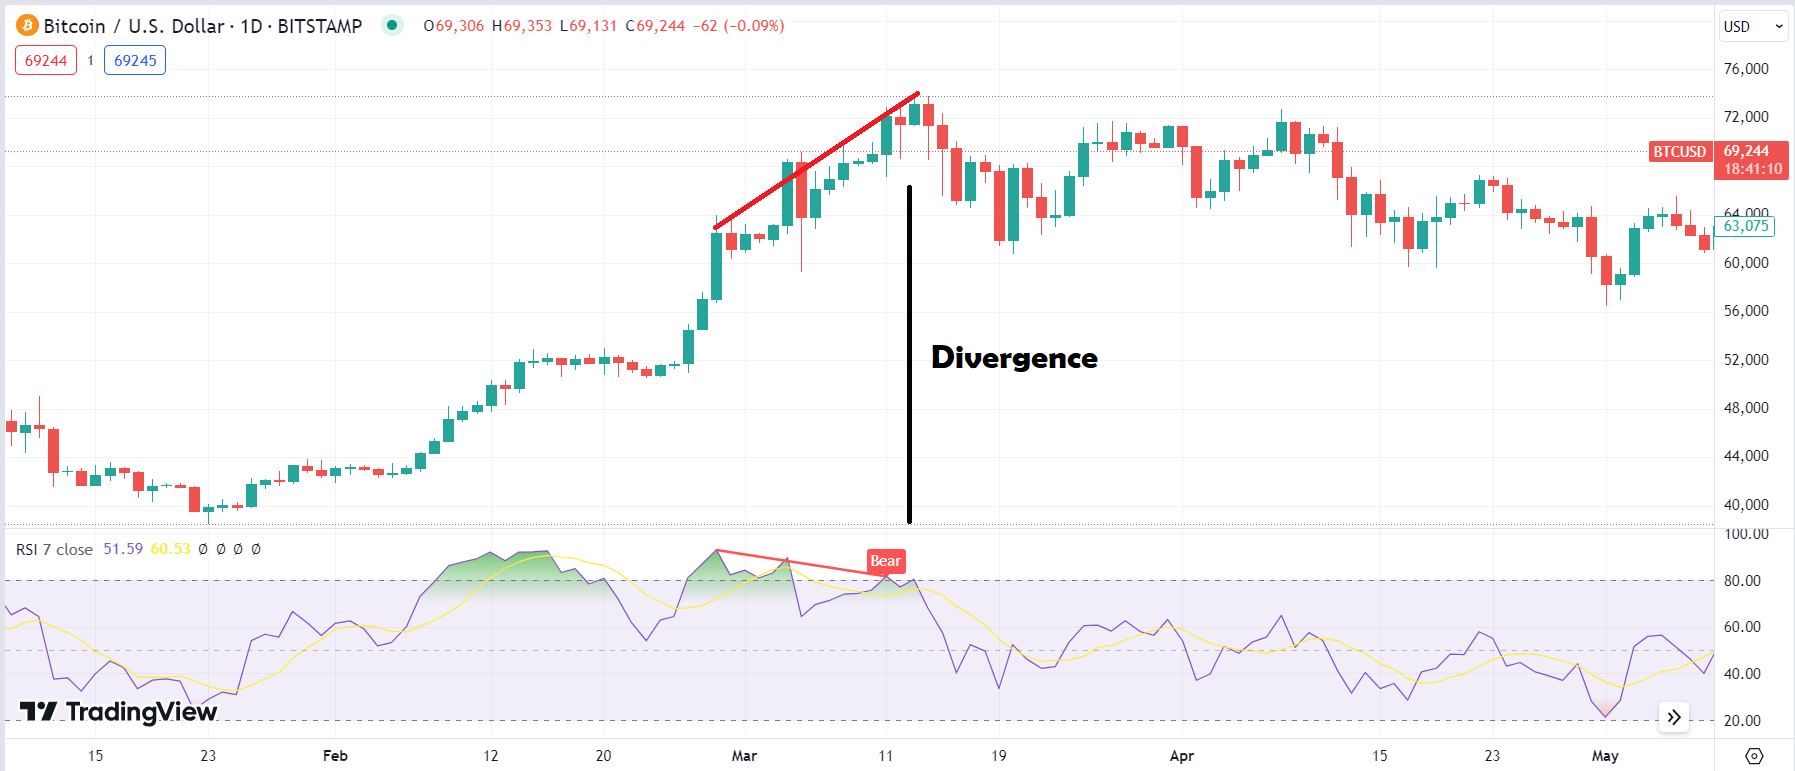 RSI is going down while price is going high.[/caption]
 - Trend Identification: RSI also helps in spotting trends, much like a seasoned surfer reading the ocean waves. A consistently high RSI in the range of 50-70 (or 50-80 for crypto) during an uptrend or a low RSI in the range of 30-50 (or 20-50) during a downtrend can confirm the strength of the ongoing trend. Note these points again: RSI would be consistently HIGH WHEN overall trend is HIGH is uptrend and vice versa. So only high RSI in overall low trend is not indicating uptrend.
Crypto Market: Adjusting the RSI Lens
In the wild world of cryptocurrency, prices can change as rapidly as ocean waves during a storm. Because of this volatility, traders often adjust their RSI settings to better navigate these tumultuous waters. Instead of the traditional 70-30 thresholds, many use 80 for overbought and 20 for oversold conditions. This adjustment helps in filtering out the noise and focusing on more significant market signals.
However, it’s crucial to remember that prices don't always bounce immediately from these overbought or oversold regions. Sometimes, just like waiting for the right wave, you may need to exercise patience. The market can linger in these regions longer than anticipated, and immediate reversals are not guaranteed. Results can be better if RSI is used with MFI or Bollinger Bands.
The Daily Timeframe: Your Go-To Window
Among the various timeframes traders use, the daily timeframe is the most popular for RSI analysis. This period provides a balanced view, capturing enough data to smooth out short-term fluctuations while reflecting broader market trends. It’s akin to looking at the tide cycles rather than individual waves, giving a clearer picture of the overall market momentum.
RSI Heatmaps: A Bird’s Eye View
For those who like to keep an eye on multiple assets simultaneously, RSI heatmaps are invaluable tools. These heatmaps provide a visual representation of RSI levels across various cryptocurrencies at a glance, much like a weather map showing wave conditions across different beaches. With just a quick look, traders can spot which coins are entering overbought or oversold territories, helping them make more informed decisions quickly.
Riding the Market Waves with RSI
In summary, the Relative Strength Index is like your trusted surfboard, guiding you through the ups and downs of the trading ocean. By understanding and utilizing RSI, especially with adjusted thresholds for the volatile crypto market, traders can better identify overbought and oversold conditions, spot divergences, and confirm trends. Using the daily timeframe offers a balanced view of market momentum, and RSI heatmaps provide a comprehensive overview of multiple assets.
Just as surfing requires practice, patience, and a keen eye on the waves, mastering RSI in trading involves similar dedication. By staying informed and vigilant, you can navigate the market's waves with confidence and skill, making the most of every opportunity that comes your way. So, grab your surfboard, keep an eye on those RSI signals, and ride the market waves to your trading success.
