

Imagine you’re at a bustling farmers' market on a Saturday morning. Each vendor has a unique spot where they sell their goods, and regular customers know exactly where to go to get the best deals. In the world of trading, an “order block” is a bit like these regular vendor spots—it’s a place on a price chart where significant buying or selling activity has taken place. Understanding order blocks can help traders predict where prices might move next, just like knowing which vendors offer the best deals can make your market trip more efficient.
What is an Order Block?
In simple terms, an order block is a zone on a trading chart where big institutions, like banks or hedge funds, have placed large buy or sell orders. These blocks indicate areas of strong support or resistance. Think of it as a footprint left behind by big players in the market. When these institutions buy or sell in large quantities, they leave a mark on the price chart, which traders can use to their advantage.
Order blocks are shown on charts as points with multiple bounce backs (as shown in image below). They are not just random occurrences; they represent a concerted effort by major players to buy or sell at specific price levels. This activity often creates a kind of "memory" in the market. Traders can look at these historical levels to gauge future price movements.
[caption id="attachment_4494" align="alignnone" width="1564"]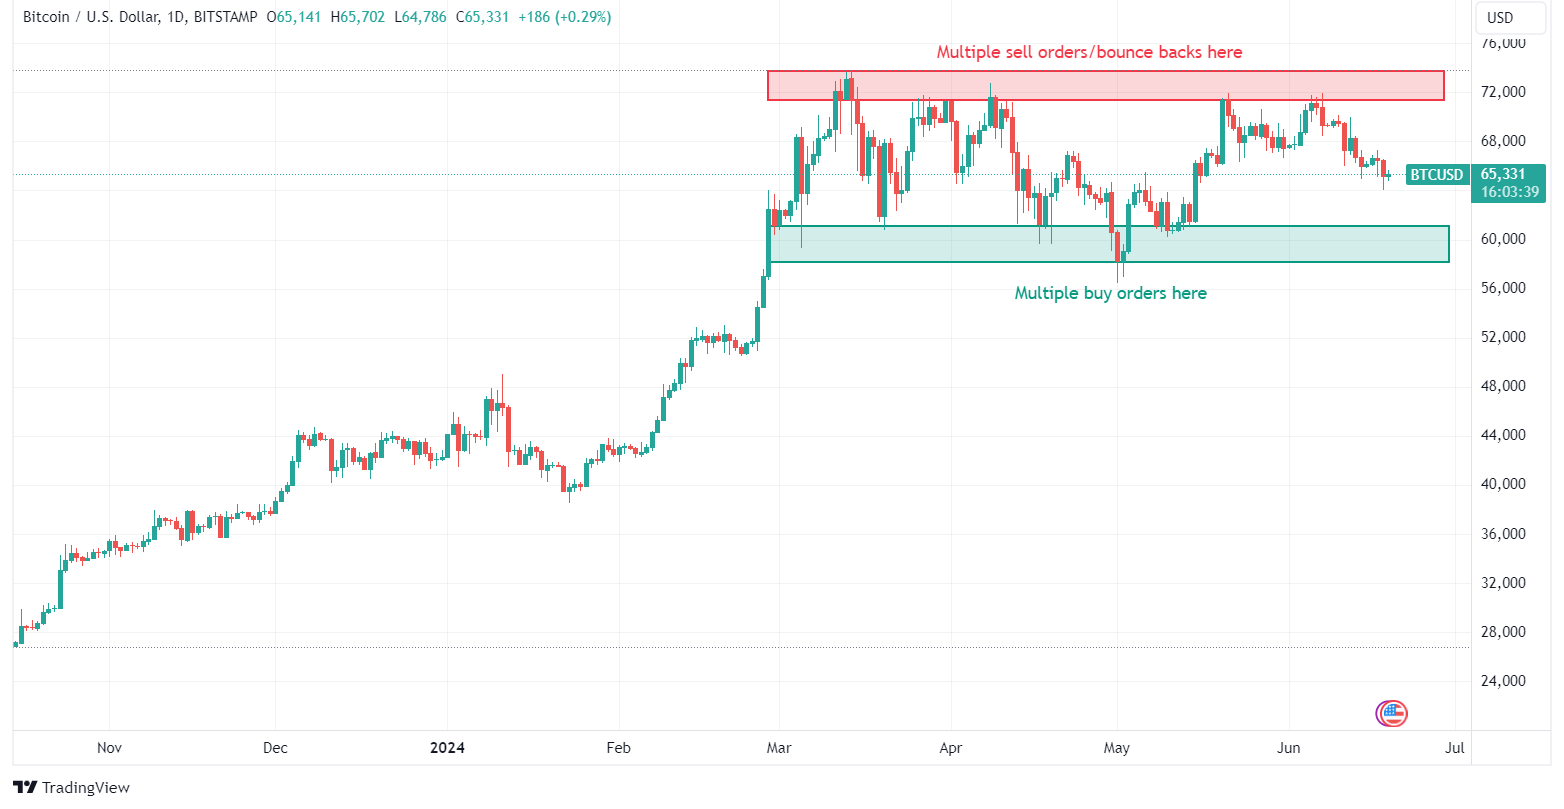 Green is buying order block and Red is selling order.[/caption]
In this chart, you can see two boxes: green and red. The green box represents a range from which the price usually bounces. This acts similarly to a support level but covers a wider range. When the price reached this range in the past, buying orders countered the selling pressure, causing the price to rise from this point. It is likely that the same situation will occur when the price reaches this range again, as traders who have observed this level will place buy orders here.
The same principle applies to the red box, which indicates a selling point. When the price reached this level previously, numerous selling orders forced it to go back down. It is likely that this scenario will repeat next time.
Note that each support, resistance, trend, and order block eventually breaks. If this were not the case, the market would always move sideways and fade away due to squeezing movements. For example, if someone bought at $60,000 and sold at $71,000, they might try to buy at $61,000 the next time to avoid missing out if the price doesn't drop to $60,000 again, and they might aim to sell at $70,000 to avoid rejection. This behavior squeezes the price, eventually causing it to stop moving. Thus, every block breaks in the end, marking the beginning of a new trend.
Why Do Order Blocks Matter?
Order blocks matter because they can signal potential price reversals or continuations. For instance, if a large institution buys a significant amount of a stock at a certain price level, that level becomes a strong support area. If the price drops to that level again, other traders might expect it to bounce back up, creating a buying opportunity.
Conversely, if a large institution sells a lot at a certain price, that level becomes a resistance area. If the price climbs back to that level, traders might expect it to fall again, creating a selling opportunity.
Order blocks provide a sort of roadmap for traders. By recognizing where large orders have previously been placed, traders can anticipate where future support and resistance levels might be. This understanding can lead to more strategic trading decisions and better risk management.
Spotting Order Blocks on a Chart
Let’s break down how you can spot order blocks on a chart:
- Identify Strong Price Movements: Look for areas on the chart where the price has moved sharply up or down. These strong moves often indicate the presence of large orders from institutions (see image above).
- Look for Consolidation Areas: Before a strong move, prices often consolidate or move sideways. This consolidation phase is where institutions might be placing their orders quietly but this is not the case always.
[caption id="attachment_4495" align="alignnone" width="1564"]
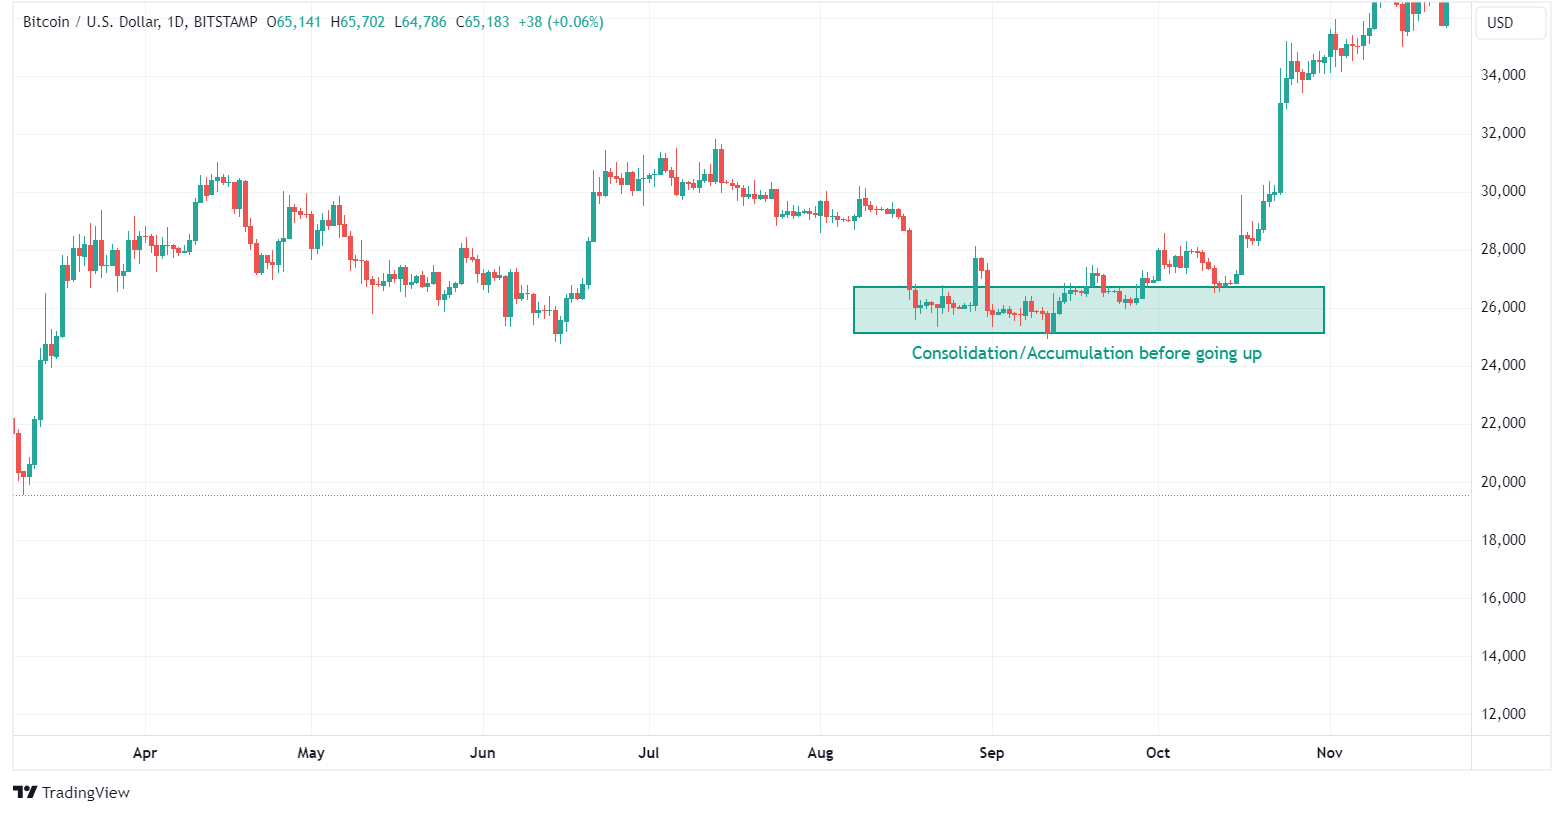 Accumulation in order block[/caption]
 - Check Volume: High trading volume during these periods of consolidation can be a clue that big players are involved. When volume spikes, it often indicates that significant buying or selling is taking place. This is not necessary for each bounce.
[caption id="attachment_4496" align="alignnone" width="1564"]
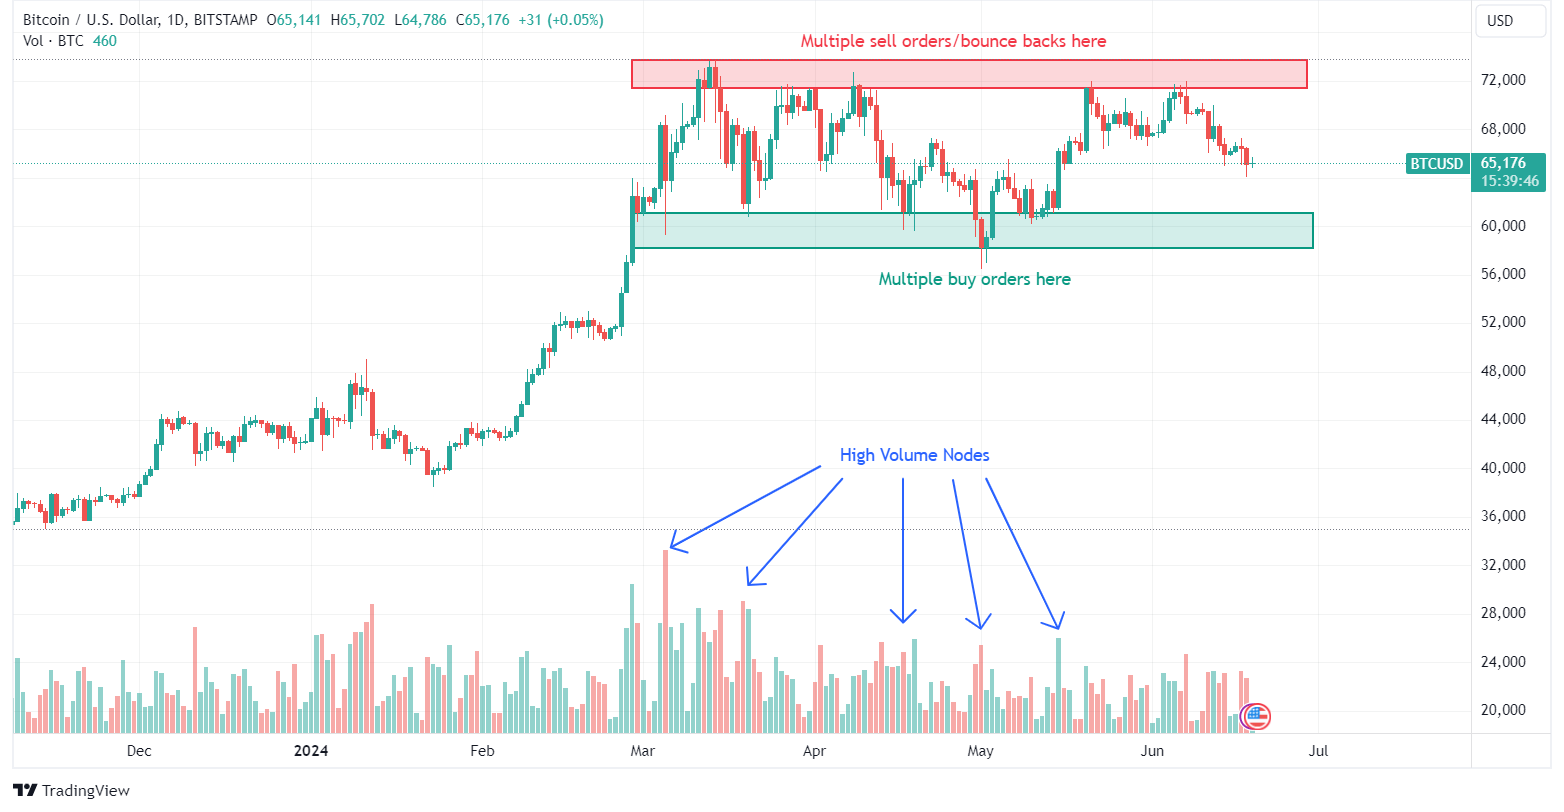 Volume when bouncing from green order block[/caption]
 - Observe Price Reactions: Notice how prices react when they revisit these areas. If prices tend to bounce back up from a specific level repeatedly, it suggests a buy order block. If they fall from a level repeatedly, it indicates a sell order block.
Real-World Example: The Farmers' Market Analogy
Imagine you’re at the farmers' market, and there’s a particular stall that always has fresh apples. One day, you notice that the vendor has put up a big sign saying “Fresh Apples, Limited Stock!” and there’s a rush of customers buying apples. The next week, you come back and see that the vendor has put up the same sign again, and once more, people are rushing to buy.
In trading terms, that vendor’s spot is an order block. The vendor (like a big institution) creates significant buying activity at that spot, and the customers (like traders) recognize this and follow suit. They know that when the vendor signals fresh apples, it’s time to buy.
Similarly, if another vendor has a surplus of oranges and slashes prices to sell quickly, you’ll notice a surge in buying activity. Next time you see those low prices, you might anticipate another rush. This mirrors how sell order blocks function in trading.
How to Use Order Blocks in Trading
Now that you understand what order blocks are, here’s how you can use them in your trading strategy:
- Set Entry and Exit Points: Use order blocks to set your entry and exit points. If you identify a buy order block, you might set a buy order just above this level. Conversely, if you identify a sell order block, you might set a sell order just below this level.
- Manage Risk: Order blocks can help you manage risk by setting stop-loss levels. For example, if you enter a buy trade at an order block, you might place a stop-loss just below the block to limit potential losses.
- Confirm Trends: Use order blocks to confirm trends. If the price is in an uptrend and you see it bouncing off a buy order block repeatedly, it could indicate that the uptrend is strong and likely to continue.
- Identify Breakout Opportunities: Sometimes, the price will break through an order block. This breakout can signal a strong move in the direction of the breakout. For example, if the price breaks above a sell order block, it might indicate a strong bullish move.
Additional Insights: The Mechanics Behind Order Blocks
To further understand order blocks, it’s useful to delve into the mechanics behind them. Large institutions don’t place their entire order at once; instead, they spread it out to avoid significant market impact. This process is known as “order slicing.” By placing smaller, incremental orders, they minimize the risk of driving the price up (when buying) or down (when selling) too quickly.
This slicing leads to the formation of order blocks instead of supports or resistances as these institutions consistently buy or sell at specific price levels over time. For retail traders, recognizing these patterns can be like finding clues in a treasure hunt. Each block provides valuable information about where the big players are likely to act again.
Practical Steps for Traders
- Use Technical Analysis Tools: Employ tools like moving averages, RSI (Relative Strength Index), and MACD (Moving Average Convergence Divergence) to complement your order block analysis. These tools can provide additional confirmation signals.
- Practice on Demo Accounts: Before implementing order block strategies with real money, practice on a demo or paper trade account. This allows you to get comfortable with identifying and reacting to order blocks without financial risk.
- Keep a Trading Journal: Document your trades, noting where you identified order blocks and the outcomes. Over time, this journal can help you refine your strategy and improve your decision-making process.
Conclusion
Order blocks are like secret maps left behind by the big players in the market. By learning to spot these maps, you can make more informed trading decisions. Just like knowing where the best vendors are at the farmers' market can help you get the freshest produce, understanding order blocks can help you navigate the financial markets more effectively.
So, next time you look at a price chart, keep an eye out for those key areas of buying and selling activity. They might just be your ticket to more strategic and successful trading. Remember, trading is both an art and a science, and mastering the concept of order blocks can significantly enhance your trading prowess. By incorporating this knowledge into your trading toolkit, you can better anticipate market movements, manage risks, and ultimately achieve your trading goals.
