Bitcoin (BTC), the largest cryptocurrency by market capitalization, is one of the best-performing digital assets so far in 2024. Despite its recent struggles in the last two quarters, the premier cryptocurrency is up by more than 137% in the past year.
Bitcoin Dominance Vs. Ethereum Up 6% In 2024
According to a recent report by IntoTheBlock, Bitcoin has put a wider gap between itself and other digital assets in the market. The blockchain analytics platform reported a 6% increase in BTC’s dominance over Ethereum (ETH) and stablecoins so far in 2024.
Data from IntoTheBlock shows that Ethereum, the largest altcoin by market capitalization, is currently trading at its lowest level against BTC. This ETH underperformance has been attributed to the relatively less successful spot exchange-traded fund (ETF) launch.
Related Reading: Ethereum Trading At 40-Month Lows Versus Bitcoin: Is This An Endorsement Of BTC?
The spot Bitcoin ETFs have amassed about $18 billion in capital over the last eight months, while the ETH ETFs have mostly recorded net outflows since launching in late July. This trend can be associated with investors’ preference for BTC due to its relative stability.
Ultimately, the introduction of the spot exchange-traded funds has helped Bitcoin assert more dominance over other assets in the crypto market. However, a popular crypto analyst on X has put forward an interesting prediction about Bitcoin dominance and altcoins in the current cycle.
Altcoin Season Might Be Here — Here’s How
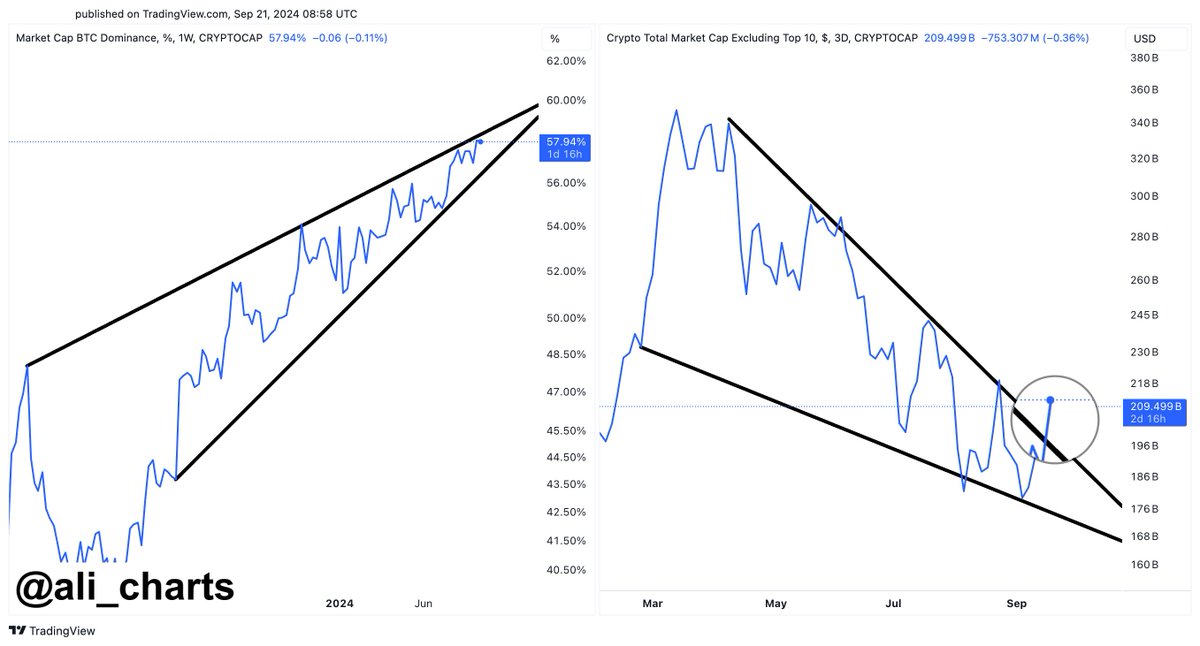
Crypto analyst Ali Martinez took to X to explain how the current Bitcoin dominance could be coming to an end and the altcoin season might just be beginning. This analysis is based on the formation of technical patterns on the BTC dominance and total market cap (excluding top 10 assets) charts.
According to Martinez, Bitcoin dominance might be gearing for a trend reversal due to the formation of a rising wedge chart pattern on the weekly timeframe. Meanwhile, the altcoin market cap seems to be breaking out of a falling wedge pattern on the three-day chart.
Source: Ali_charts/X
Related Reading: Bitcoin Coinbase Premium Turns Deep Red: What Does It Mean?
For context, a wedge is a technical analysis pattern characterized by converging trend lines on a price chart. A rising wedge, which often occurs in an upward trend, is a bearish signal, indicating that the price is about to undergo a breakout reversal. A falling wedge, on the other hand, often signals a bullish reversal.
Martinez highlighted in his post that the “altcoin season is just around the corner,” especially with the Bitcoin dominance chart signaling a potential trend reversal and the altcoin market cap witnessing a bullish breakout.
As of this writing, the total market cap outside of assets in the top 10 stands at around $213.814 billion.
Total market cap (excluding top 10 assets) on the daily timeframe | Source: OTHERS chart on TradingView
Featured image created with Dall.E, chart from TradingView

